Introduction
The grant rate of invention patents is one of key index to measure the quality of technological innovation and the level of research and development. Its changing trend can not only reflect the effectiveness and innovation of patent application in a specific period, but also reflect the activity of technology developments in the corresponding field and the intensity of market competition.
In recent years, there has been widespread feedback within the prosecution field that obtain allowance for invention patents in China has become more challenging, with an increasing number of rejection decisions being received. To delve into this phenomenon, this report focuses on several key technological fields and systematically analyzes the trajectories of changes in the grant rates and year-on-year growth rates of the number of invention patents granted for their invention patent applications from 2020 to the first half of 2025. The aim is to provide a reference basis for relevant research and decision-making.
1. Definition of grant rate and year-on-year growth rate of the number of invention patents granted
1.1. Grant rate
In this report, the grant rate can be understood as follows:Grant rate refers to the ratio of the number of invention patents granted announced in a certain period of time to the accumulative number of invention patent applications in that period;Among them, the accumulative number of invention patent applications is the sum of the number of invention patents granted, the number of invention patents rejected and the number of withdrawals. It should be specially noted that the statistical standard for the number of invention patents granted is "the invention patents granted announced in a certain period", not the invention patents whose final legal status is "granted". This is because the invention patent may become invalid for other reasons (such as unpaid annual fee) after being granted,so it can more accurately reflect the actual granting situation in a specific period to include such invalid granted patents in the statistical scope. The number of invention patents rejected and the number of withdrawals are based on the invention applications whose legal status are "rejected" or "withdrawn" respectively.
1.2 year-on-year growth rate of the number of invention patents granted
In this report, the year-on-year growth rate of the number of invention patents granted can be understood as follows:
Year-on-year growth rate = (the number of invention patents granted this year-the number of invention patents granted last year)/the number of invention patents granted last year *100%.
In particular, for the annual number of invention patents granted in 2025, its value is simply estimated by twice the number of invention patents granted from January to June 2025."Year-on-year growth rate of the number of invention patents granted" can often reveal the changing trend of allowance difficulty better than "grant rate". The reason is that the "year-on-year growth rate of the number of invention patents granted" can filter the influence of fluctuation of the accumulative number of application or cases closed, and the growth rate focuses on the change range of the number of invention patents granted relative to the same period of last year. It naturally partially offsets the impact of changes in the number of applications or closed cases. Even if the number of applications or closed cases continues to increase, if the growth rate of the number of invention patents granted slows down or even decreases significantly, it implies that the threshold for obtaining allowance is increasing.
2. Overview of the development trend of invention patents in various technical fields
This report selects the following technical fields: video coding and decoding, 5G communication, artificial intelligence (covering computer, control system, unmanned aerial vehicle, image processing, vision, image acquisition and other topics), new materials (including advanced petrochemical new materials, high-performance fibers and products and composite materials, advanced inorganic non-metallic materials, advanced steel materials, advanced non-ferrous metal materials, cutting-edge new materials), polyamide/copolyamide,and household appliances (including vacuum cleaners, hair dryers, sweeping robots, etc.), electronic cigarettes, elevators, semiconductors and integrated circuits, electrical connectors, motors, power batteries, intelligent driving and surgical robots.The above fields cover both popular field (such as artificial intelligence, new materials, 5G communication, etc.) and traditional machinery field (such as household appliances, elevators, etc.).
The above 15 fields are divided into two categories: the first category is the field with an average grant rate of more than 50%, and the second category is the field with an average grant rate of less than 50%. In view of these two kinds of fields, the development trend of each field will be analyzed from two dimensions: grant rate and year-on-year growth rate of the number of invention patents granted.
2.1. The first category
The first field includes seven fields: video coding and decoding, neural network, intelligent driving, power battery, artificial intelligence, semiconductor and surgical robot.
2.1.1. After statistics, the grant rates of these seven fields are shown in the following table.
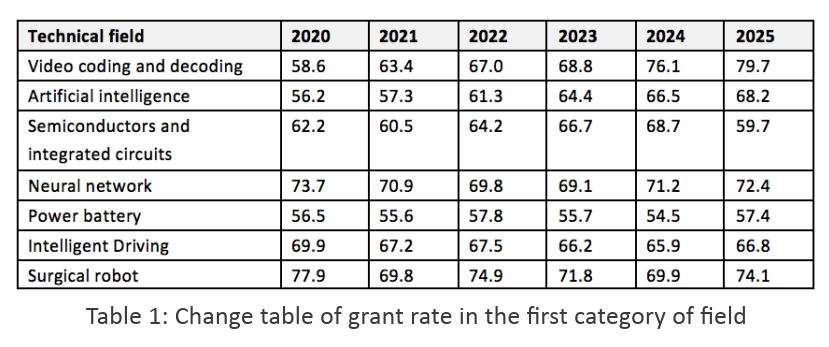
The change curves of the grant rates of the above seven first-class fields are as follows:
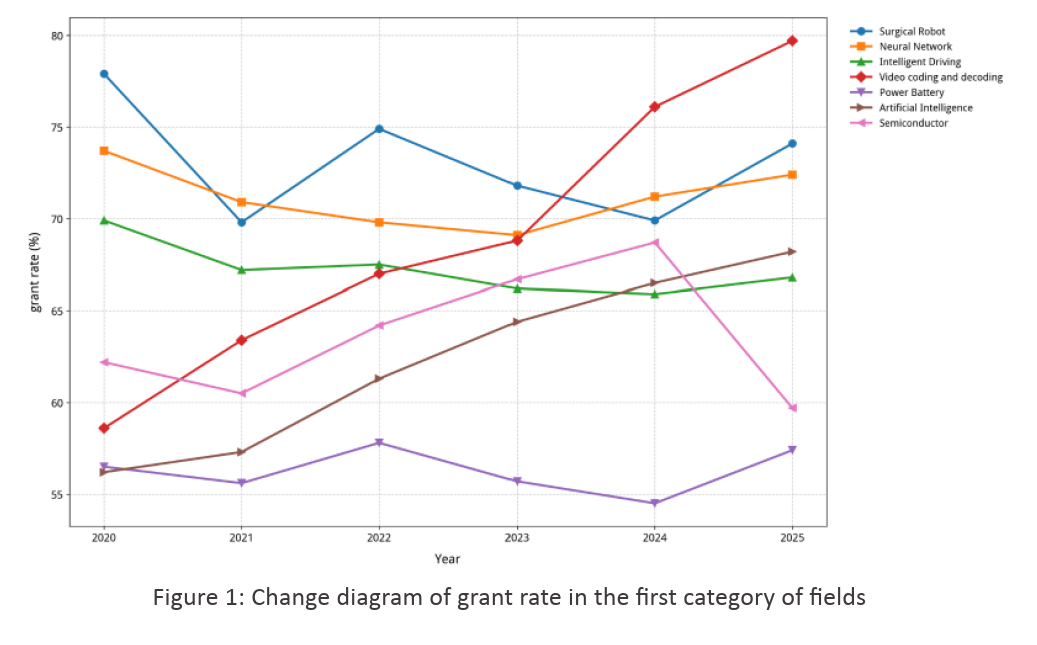
a. Video encoding and decoding (red)
Trend: It continues to rise, from 58.6% in 2020 to 79.7% in 2025, with an increase rate of 36%, which is the fastest growth in all fields. In addition, it has the highest grant rate in 2025 from all of years.
Features: The growth rate accelerates after 2023, and it exceeded 75% in 2024-2025.
b. Neural network (orange)
Trend: It drops from the high fluctuation and then rises, reaching 73.7% (the initial highest) in 2020, falling to 69.1% in 2023 and rising to 72.4% in 2025.
Features: Overall, maintain a high grant rate of about 70%.
c. Intelligent driving (green)
Trend: After a slow decline, it will stabilize, reaching 69.9% in 2020, 67.2% in 2021, and slightly rising to 66.8% in 2025.
Features: It briefly rebounded to 67.5% in 2022-2023, showing a moderate downward trend for a long time.
d. Power battery (purple)
Trend: It fluctuates slightly, from 56.5% in 2020 to 57.8% in 2022 to 57.4% in 2025, and the overall range is main-tained at 55%-58%.
Features: The overall grant rate is relatively stable.
e. Artificial intelligence (Brown)
Trend: It is rising steadily, from 56.2% in 2020 to 68.2% in 2025, with an average annual growth rate of 2.4%.
Features: The growth rate will accelerate after 2022.
f. Semiconductor (pink)
Trend: It first rises and then falls, 62.2% in 2020 → 68.7% (peak) in 2024 → 59.7% (decrease by 9%) in 2025.
Features: Significant decline in 2025.
g. Surgical robot (blue)
Trend: Fluctuation decreases and then rises, with 77.9% in 2020 (initial highest) → 69.9% in 2024 → 74.1% in 2025.
Features: It plummeted to 69.8% in 2021, then slowly recovered and returned to 74% in 2025.
Summary
1) Rapid growth areas: video coding and decoding (+21.1%), artificial intelligence (+12%)
2) High stability fields: neural network (70%-74%), surgical robot (69%-78%), power battery (55%-58%).
3) Highly challenging areas: semiconductors (significantly declining in 2025) and power batteries (fluctuating)
2.1.2. According to statistics, the year-on-year growth rate of the number of invention patents granted of these seven fields is shown in the following table:
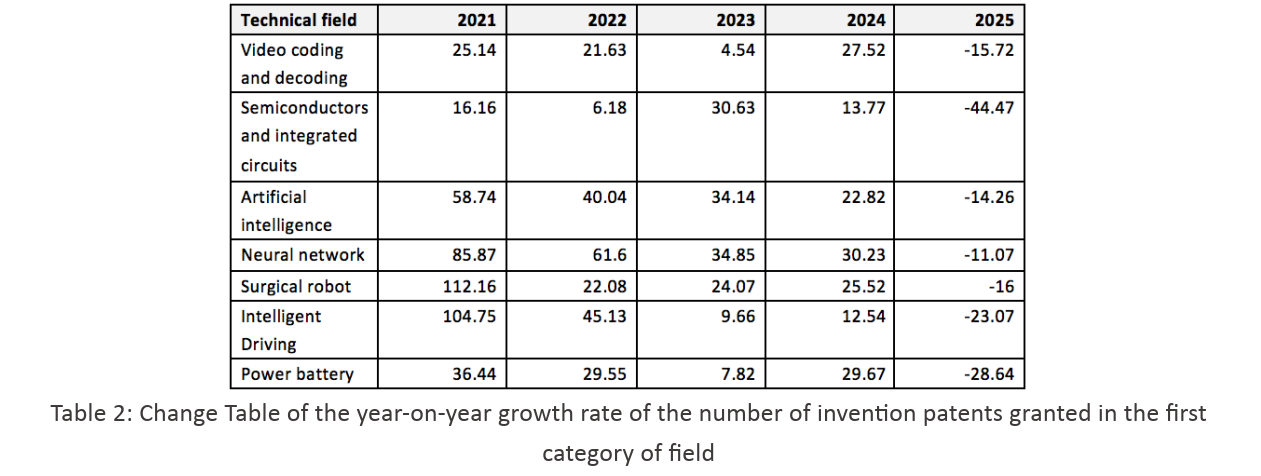
The change curve of the year-on-year growth rate of the number of invention patents granted of the above seven first-class fields is as follows:
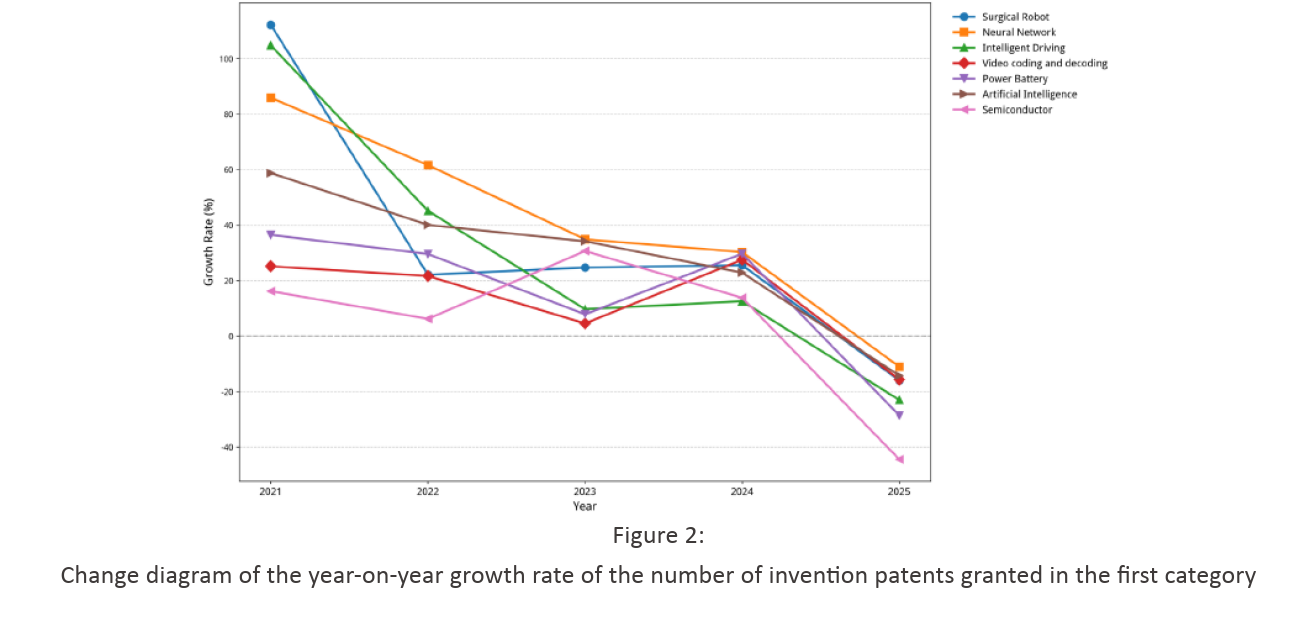
In 2021, the growth rate of six fields will exceed 25%, with intelligent driving (104.75%) and surgical robots (112.16%) reaching historical peaks. By 2023, there will be a trend of differentiation, with semiconductors (30.63%) and power batteries (29.67%) still growing rapidly, while intelligent driving (9.66%) and video coding and decoding (4.54%) will grow slowly. In 2025, all fields experienced negative growth, with semiconductors (-44.47%) and power batteries (-28.64%) becoming the hardest hit areas.
2.2. The second category
The second category includes 8 fields: 5G communication, new materials, polyamide/copolyamide, household appliances, electronic cigarettes, elevators, electrical connectors and motors.
2.2.1. According to statistics, the grant rates of these eight fields are shown in the following table.
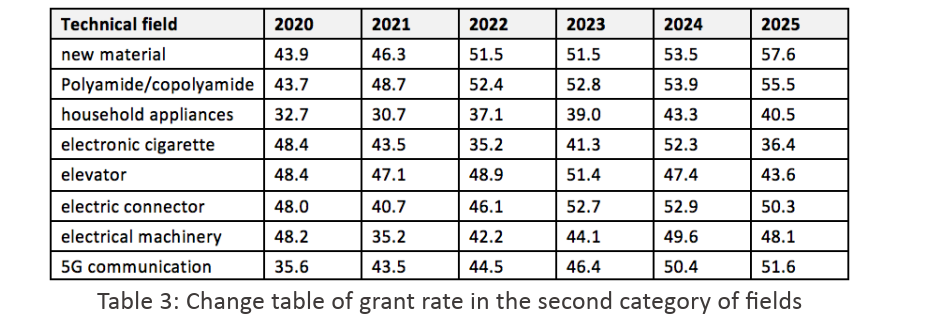
The change curve of grant rate in the above eight application fields is as follows:
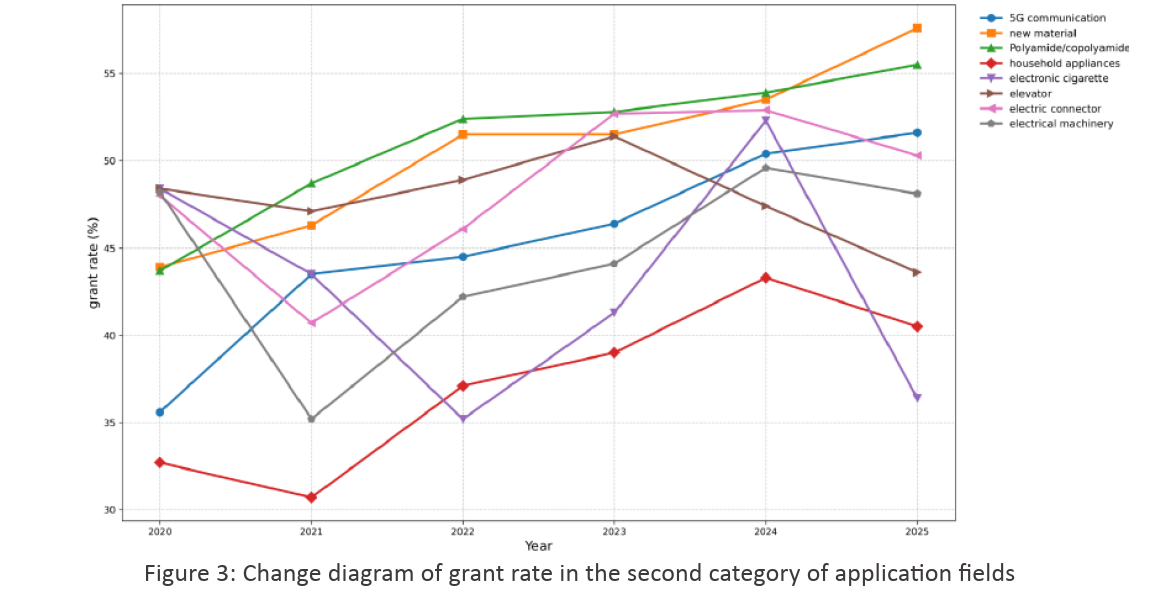
a. 5G communication (blue)
Trend: It is rising steadily, from 35.6% in 2020 to 51.6% in 2025, with an average annual growth rate of 3.2%.
Key nodes: exceeding 40% in 2021, exceeding 50% in 2024 and reaching to 51.6% in 2025.
Features: Steady growth, no obvious fluctuation.
b. New materials (orange)
Trend: Sustained rapid growth, from 43.9% in 2020 to 57.6% in 2025, with an increase of 13.7%, the highest in all fields.
Key nodes: exceeding 50% in 2022, and the growth rate accelerating from 2024 to 2025, with an increase of 4.1% in two years.
Features: continuous rise.
c. Polyamide/Copolyamide (Green)
Trend: It rises steadily, from 43.7% in 2020 to 55.5% in 2025, with an increase of 11.8%.
Key nodes: exceeding 50% in 2022 and maintaining a high level of more than 52% in 2023-2025.
Features: Steady growth.
d. Household appliances (red)
Trend: first rising and then falling, 32.7% in 2020 → 43.3% (peak) in 2024 → 40.5% in 2025.
Key node: It reached the bottom of 30.7% in 2021, and continued to rise in the next four years, and fell slightly in 2025.
Features: Great fluctuation.
e. Electronic cigarette (purple)
Trend: overall decline, from 48.4% in 2020 to 36.4% in 2025, with a decrease of 12%.
Key nodes: It briefly rose to 52.3% in 2024 and plummeted by 15.9% in 2025, which was the largest single decline.
Features: The lowest grant rate is in 2025 among all of the years.
f. Elevator (brown)
Trend: Fluctuation decreases, from 48.4% in 2020 to 43.6% in 2025, with a decrease of 4.8%.
Key node: it reached a peak of 51.4% in 2023, and continued to decline in the following two years.
Features: In the traditional manufacturing field, the overall grant rate is not high.
g. Electrical connector (pink)
Trend: The fluctuation is rising, from 48.0% in 2020 to 50.3% in 2025, with an increase of 2.3%.
Key nodes: It reached a peak of 52.7% in 2023 and declined slightly in 2025.
Features: In the field of basic parts, the grant rate is maintained in the range of 48%-53%, with strong stability.
h. Motor (gray)
Trend: V-shaped recovery, 48.2% in 2020 → 35.2% in 2021 (bottom) → 48.1% in 2025 (close to the initial value).
Key nodes: the grant rate plummeted in 2021 and gradually recovered in the next four years.
Features: In the traditional fields, it basically returns to the level of 2020 in 2025.
Summary:
1) High growth areas: new materials (+13.7%), polyamide/copolyamide (+11.8%) and 5G communication (+16%);
2) Highly challenging areas: e-cigarettes (-12%), elevators (-4.8%) and household appliances (with large fluctua-tions);
3) Stability field: electrical connector (fluctuation 5%) and motor (long-term stability).
2.2.2 After statistics, the year-on-year growth rate of the number of invention patents granted of eight second
category of fields is shown in the following table:
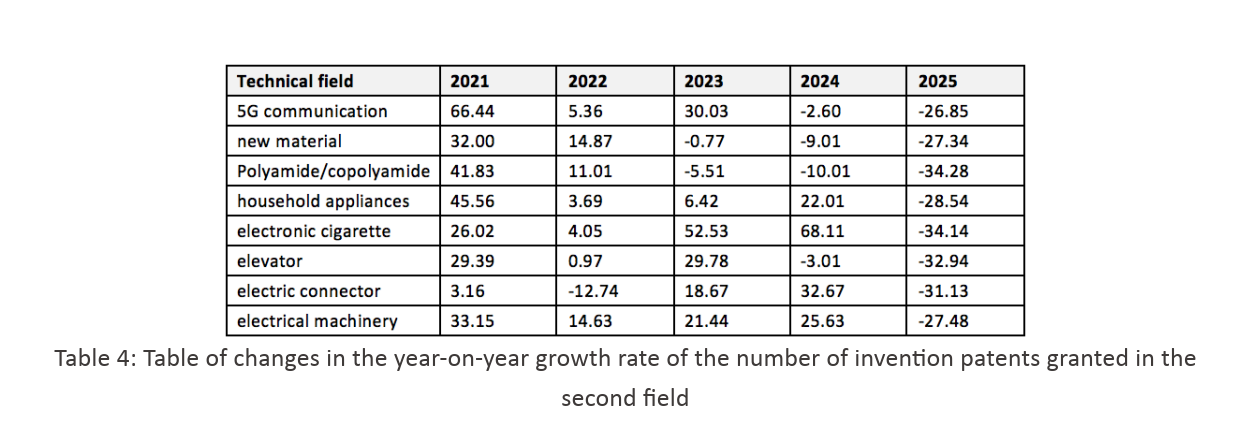
The change curve of the year-on-year growth rate of the number of invention patents granted in the above eight fields is as follows:
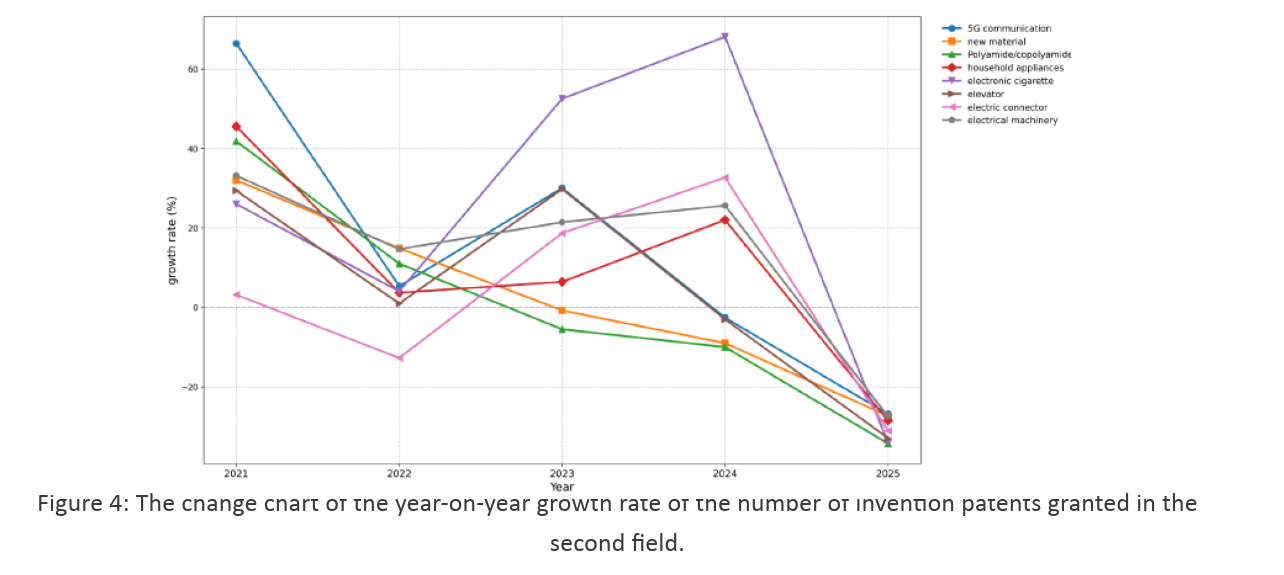
In 2021, high growth will be achieved in most areas. In 2022, although the number of invention patents granted is still increasing, the growth rate generally slows down or even drops sharply. For example, elevators (0.97%), household appliances (3.69%) and electronic cigarettes (4.05%) are close to stagnation. From 2023 to 2024, there was a trend of differentiation. E-cigarettes (52.53%→68.11%) and electrical connectors (18.67%→32.67%) showed high growth, while polyamide/copolyamide (-5.51%) and new materials(-0.77%)showed negative growth. In the first half of 2025, the growth rate of all fields was negative, with an average decline of 29.5%, with the decline of polyamide/copolyamide (-34.28%), e-cigarette (-34.14%) and elevator (-32.94%) being the most serious.
3. Analysis
Through the comparative analysis of the first and second categories of fields, it can be clearly observed that there are significant differences between the grant rates of different technical fields. Although there are fluctuations and individual slow declines in the first category, its overall grant rate remains at a high level. In the second category, although there is a partial upward trend, the overall grant rate continues to be in a low range. This differentiation is mainly due to two factors:
Intergenerational differences in technology: the first category is mostly hot fields in recent years (such as AI and semiconductors), and there is a broad space for innovation. The second category is dominated by traditional application field that have developed for many years (such as home appliances and elevators), and the space for technical iteration is relatively limited.
Policy-oriented function: The first category of fields generally belongs to the field supported by national strategies, and the innovation activity driven by policies is significantly higher.
It is worth noting that there is also obvious differentiation within the category:In the first category, video coding and decoding: the grant rate continues to rise (58.6% in 2020 → 79.7% in 2025), highlighting the high technical activity and maturity.
Semiconductor: In 2025, the grant rate plummeted by 9 percentage points (68.7%→59.7%), reflecting the dual pressures of innovation bottleneck and stricter examination in the field.
In the second category, new materials/polyamides: the average annual growth rate of the number of invention patents granted exceeds 3% (such as new materials +13.7%), reflecting the innovation breakthrough driven by green transformation demand;Electrical connector/motor: the grant rate is stable in the range of 48%-53%, showing the toughness of traditional basic technology.
Finally, although there are obvious differences in the grant rate between the first category of fields and the second category of fields, they have one thing in common: the year-on-year growth rate of the number of invention patents granted is generally declining. It is particularly noteworthy that by 2025, the year-on-year growth rate of the number of invention patents granted in all fields will show negative growth.
4. Conclusion
Generally speaking, the grant rate of invention patents in China does not show a downward trend in all technical fields, and even continues to rise in some fields-this phenomenon at first glance seems to deviate from the widely perceived "more difficulties in grant and more rejections" in the field.
In this regard, it is necessary to make a special clarification: the increase in the number of "rejection decisions" in the examination opinions does not mean that the number of patents with the final legal status of "rejection" has surged. The key difference between the two is:
The "rejection decision" is the intermediate conclusion in the examination stage, and the applicant can seek allowance through reexamination;
Legal status of "Rejection": only refers to final rejection, that is, all the following conditions are met: no reexamination is made after receiving the rejection decision; or after a reexamination/lawsuit is filed, the rejection decision is upheld; and no further judicial proceeding have been initiated.
Therefore, the perceived "increase in rejection" in the field is actually an increase in rejection decisions in the examination process. Since the review process usually takes 1-2 years, such data actually reflect the lagging pressure, rather than the overall reduction of the possibility of final allowance.However, as mentioned above, the "year-on-year growth rate of the number of invention patents granted" can peel off the influence of surface factors such as the number of applications or the number of closed cases, and more directly and sensitively reflect the tightness change of patent examination standards, that is, the actual difficulty fluctuation of obtaining invention patent allowance. The research on the year-on-year growth rate of the number of invention patents granted in this paper shows that the year-on-year growth rate of the number of invention patents granted in various technical fields generally shows a downward trend. Especially in 2025, the year-on-year growth rate of the number of invention patents granted in all fields is negative. This data result is consistent with the general trend of "the difficulty of allowance and the increase of rejection" generally perceived in the field. Although the "rejection decision" in the intermediate link may not be equal to the final "rejection" state, the overall slowdown or even negative growth in the growth rate of the number of invention patents granted confirms the current situation of the field with stricter patent examination standards and higher allowance threshold.